
Kenan Scott
Monday, August 19, 2024
Zabbix
Zabbix is a popular tool to monitor network and computing resources. But I have also used it to gather data about buildings’ energy use and present it so that changes can be made to save money. For this project at YWAM Harpenden, I connected Zabbix to boilers, heat energy meters, electrical energy meters, and thermostats. A variety of connection methods were used: the boilers were connected directly by Modbus TCP, the meters by Modbus via an Ethernet gateway, and thermostats by a web API.
Challenges
While statistics on building devices is often available, it is usually limited in terms of timescale. For instance, you may have an electrical meter that counts exactly how much electricity your building has used since it was installed. However, for this meter to useful, you will need to regularly write down the reading (or access it from your electricty provider’s invoice). For example, you may record the reading each month: with this information you will be able to compare your electrical use by month. What are the disadvantages of this?
- You must be sure to record a reading with strict adhearence, lest your data become inaccurate. This may take a considerable amount of time depending on your schedule and number of meters.
- The timescale is quite limited, so you will not able to compare data over fine periods. For most people, recording any more often than every month would not be practical.
- Some data may not be able to recorded manually. For example, you may wish to use your electrical meter to determine maximum power drawn, and when.
The Big Advantage
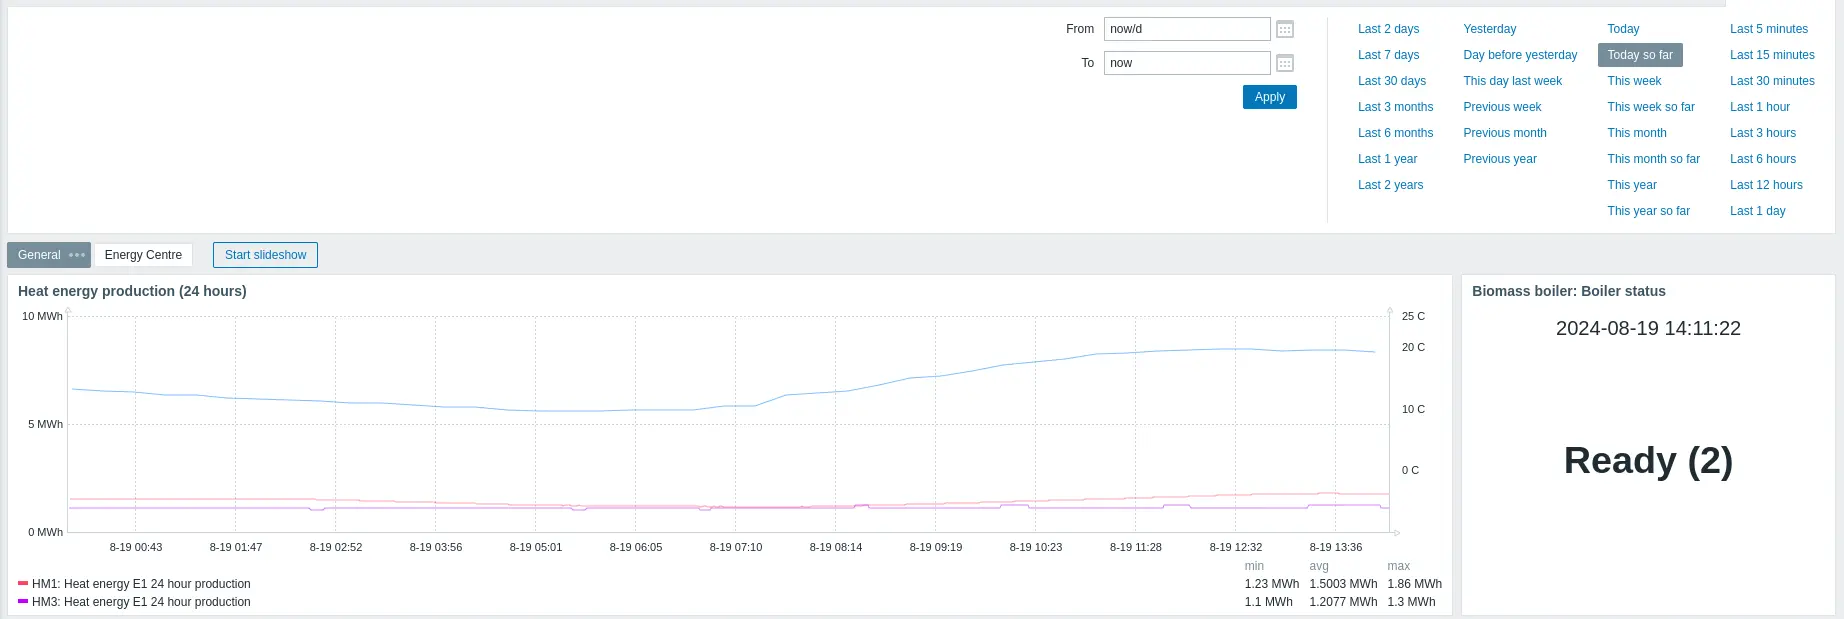
Zabbix makes it possible to automatically record data from your meters and other devices, at any desired schedule. On this project, most of the readings are made every minute, giving a high amount of visibility into energy production and use. Zabbix allows the end-user to select which time period there are interested in, to easily see reports on what they are interested in. The end-users have the ability to build dashboards which contain the data they are reguarly interested in. For example, see a part of a dashboard below that I built which gives a quick look at a boiler’s heat production, building heat use, and exterior temperature over time.
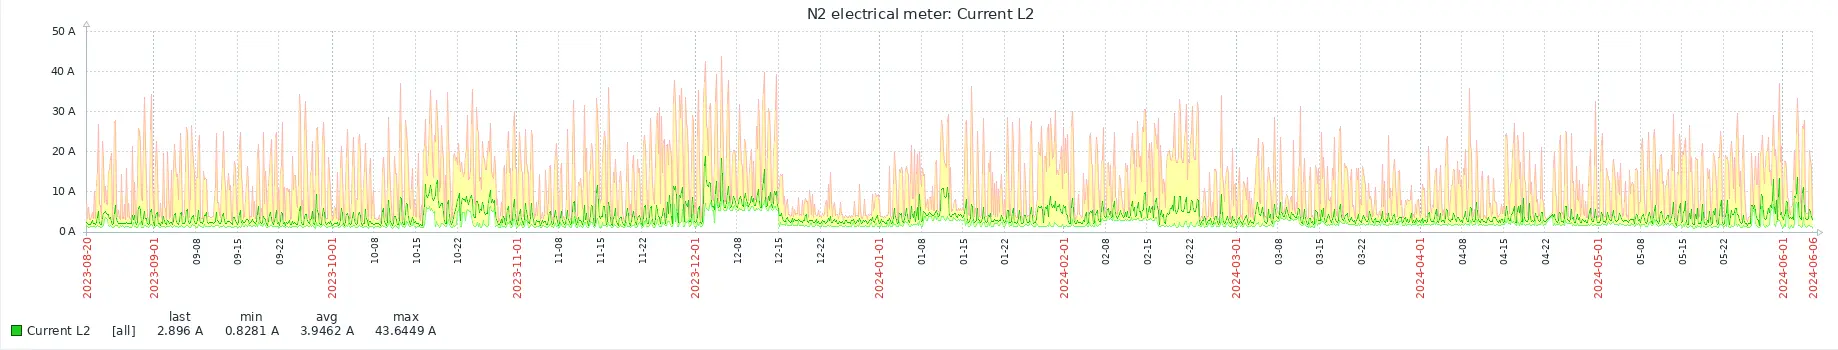
In the next chart, a specific data point is being analysed, to determine the maximum power use in a building, over about a year.
Custom dashboards
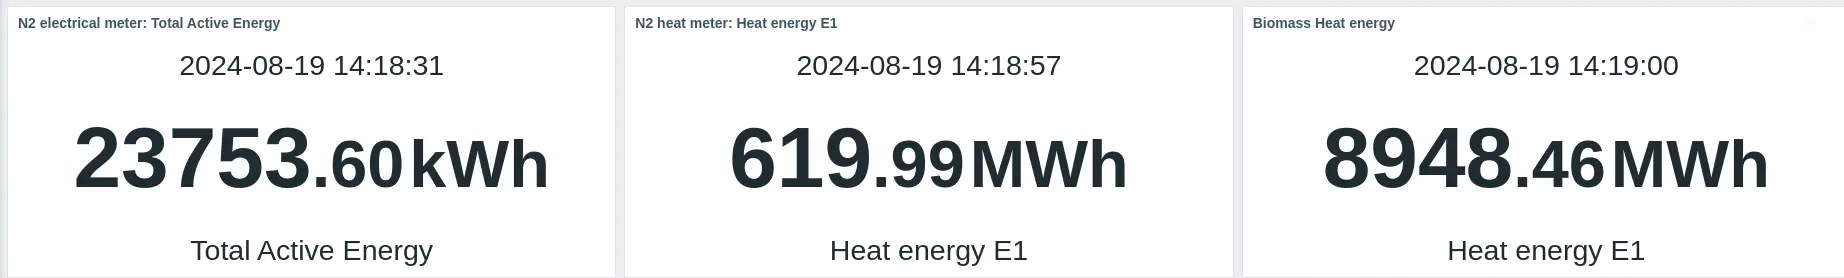
Different dashboards and be created for different groups. I created a very simple dashboard for the Accounts team, that simply presents three live meter readings, to meet their needs. There is no need to send an email or go somewhere to look at a meter, they simply need to open a webpage.
IT
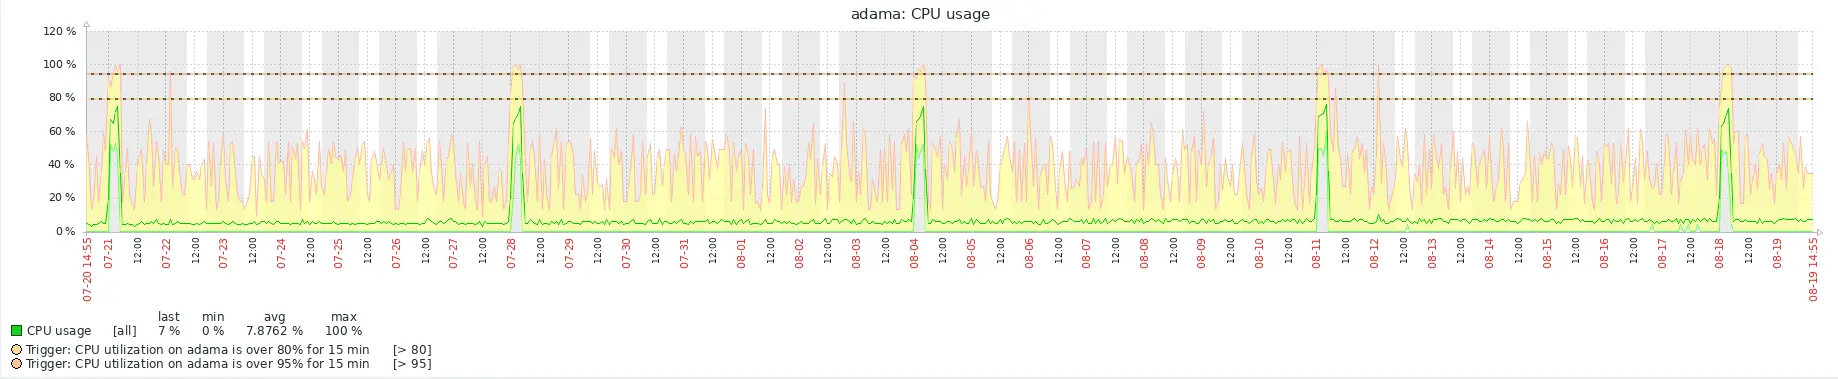
Monitoring IT resources is the more-common use of Zabbix, I used the same server to monitor network and server resources. You can see a graph of one of the server’s CPU usage below.
What about you?
Your teams may be able to benefit by automatic monitoring of building and IT resources. Reach out and I would be delighted to discuss your needs and how I can help.